Results 1 to 7 of 7

Thread: New Mickey Mouse Index (Property Price Index)

  1. #1
    ikan bilis's Avatar
    ikan bilis is offline i'm Buaya ! Girls BEWARE !!...
    Join Date
    Apr 2011
    Posts
    1,385

    Default New Mickey Mouse Index (Property Price Index)

    New Mickey Mouse Index... some "sub-index" inside NUS Singapore Residential Price Index (SRPI)...

    Measure how fast the mice are growing...

    Jumps a lot…


    http://www.ires.nus.edu.sg/srpi/srpi_main.aspx

    http://www.ires.nus.edu.sg/srpi/Pres...28July2011.pdf

  2. #2
    Join Date
    Dec 2009
    Posts
    6,003

    Default

    Thanks to CM4 40% downpayment, 1-2 bedders MMs will continue to do well. Precisely because of the 40% downpayment, the MM owners have good holding power.

  3. #3
    Join Date
    Oct 2010
    Posts
    653

    Default

    A property index that thinks out of the shoebox
    New NUS index launched, first reading confirms shoebox units outperform in apartments market

    By KALPANA RASHIWALA


    (SINGAPORE) Finally, an index has been minted that monitors price changes for shoebox apartments. And it shows what market players have observed for some time now - that price increases of shoebox apartments have been outpacing gains in overall apartment prices since the property market recovery following the global financial crisis.


    The indices, from NUS's Institute of Real Estate Studies (IRES), show that since the post-financial-crisis- low in March 2009, its sub-index for prices of completed non-landed private homes that are up to 47 square metres (506 square feet) has posted a compounded annual growth rate (CAGR) of 24 per cent. This is higher than the 19.6 per cent for non-landed private homes (excluding small units) in the Central region, which covers districts 1-4 and 9-11, and a rise of 21 per cent in the Non-Central region (again excluding small units).


    Associate professor Lum Sau Kim of IRES said that the sub-index for shoebox units was produced as 'this is important market information which will help us understand the price behaviour of different segments of the market'.


    Credo Real Estate executive director Ong Teck Hui said: 'It is certainly useful to track price trends of small apartments separately as their per square foot prices are vastly higher than usual size units and can distort the changes in price indices.'


    IRES observed that unlike the pre-crisis run-up in private home prices where the price movement of small units tended to follow the movement of Central region properties, demand- led price inflation of small units now precedes the appreciation of prime units.
    IRES, which has been releasing the Singapore Residential Price Index (SRPI) that tracks price changes in its basket of completed non-landed private residential properties since March last year, has now created a sub index, SRPI Small, to track the price movement of completed small apartments with a strata area of 47 sq m or less.


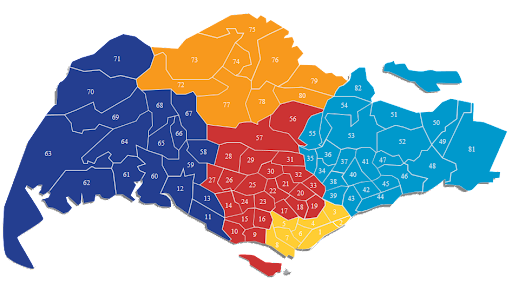
    There is now an overall SRPI and three sub-indices - SRPI Small (for small units islandwide); and two other indices that exclude small units: SPRI Central for the Central region (Districts 1-4 and 9-11) and SRPI Non-Central, for all other locations.


    The indices show that prior to the financial crisis, small units took their price cue from the SRPI Central region index, a proxy for prime properties. The SRPI Small index reached its pre-crisis peak in February 2008, later than the other three indices including SRPI Central, which peaked in December 2007. Between the pre-crisis low and pre-crisis peak, the compounded annual growth rate in the SRPI Central was 28.2 per cent, outpacing all the other indices, including SRPI Small, which posted a CAGR of 25.5 per cent.


    Following the crisis, all the indices bottomed in March 2009, and from that point, the sub-index for small units has risen 62.2 per cent (till June 2011), reflecting a CAGR of 24 per cent. This is higher than the CAGR for the other indices, especially SRPI Central.
    The current basket of properties for the indices was constituted in December 2009. It will next be revised at the end of this year. The base period for the indices is December 2001. Given that shoebox units came into focus in 2009 and that all the indices have a common post-crisis nadir, March 2009, IRES rebased its indices to that month to paint an even clearer picture. The finding: 'SRPI Small is the most volatile with substantial inflation around mid-2009 and more recently.'


    Between January 2010 and May 2010, it climbed 11.1 per cent (or an average of 2.8 per cent per month) despite a temporary reversal in March 2010 after the introduction of cooling measures in February last year. Over the same period (January-May 2010), non-landed private residential properties (excluding small units) in the Central and Non-Central regions saw considerably lower capital gains of 5.4 per cent (or 1.4 per cent per month) and 6.2 per cent (1.5 per cent per month) respectively.


    After the latest January 2011 property cooling measures, the prices for small units grew 6.9 per cent from March to May this year (averaging 3.4 per cent per month) - again faster than price gains of 3 per cent (or 1.5 per cent per month) for non-landed units in both the Central and Non-Central regions.


    'Taken together, the macro-prudential measures to tighten private housing credit could have boosted demand and supported stronger price inflation for small units relative to larger units,' IRES said.


    The current basket comprises 363 non-landed private residential projects completed between October 1998 and September 2009. The basket's composition is adjusted every two years. The new sub-index for small apartments is based on a basket of completed apartments, whereas most of the action in the shoebox apartment market has been at new property launches. However, Prof Lum says that 'prices for new launches of shoebox units will also have an impact on prices of completed small apartments in our basket'.


    'Come December 2011 when we reconstitute our basket, we will have an opportunity to have a larger representation of completed shoebox units.'


  4. #4
    Join Date
    Nov 2009
    Posts
    2,368

    Default

    Looks like the shoebox investors may have the last laugh. Clearly the shoeboxes way outperformed the standard units MM huat ah!

    This index only tracks completed shoeboxes which is not a lot. Would be interesting to see the performance as more shoeboxes TOP. The other thing the report clearly shows is that shoebox is more prevalent in central regions and cause greater distortion in index in central areas - i think a lot of forummers have sent wrong signals that OCR has a lot of shoebox which is a lie. Even the shoebox in "non-central" areas are probably located in RCR (East Coast, Geylang and Balestier) and not OCR. The NUS index unfortunately does not segregate RCR and OCR.

  5. #5
    Join Date
    Jun 2011
    Posts
    519

    Default

    Quote Originally Posted by Wild Falcon
    Looks like the shoebox investors may have the last laugh. Clearly the shoeboxes way outperformed the standard units MM huat ah!

    This index only tracks completed shoeboxes which is not a lot. Would be interesting to see the performance as more shoeboxes TOP. The other thing the report clearly shows is that shoebox is more prevalent in central regions and cause greater distortion in index in central areas - i think a lot of forummers have sent wrong signals that OCR has a lot of shoebox which is a lie. Even the shoebox in "non-central" areas are probably located in RCR (East Coast, Geylang and Balestier) and not OCR. The NUS index unfortunately does not segregate RCR and OCR.
    MM makes property more like a stock...first to rise..first to fall...

    But I wont be very hopeful for rental returns projected as there are too many MM coming up by FEO..think all developes will do the same and eventually MM will become a normal phenomenon..same price as normal units..

  6. #6
    Join Date
    Oct 2010
    Posts
    653

    Default


  7. #7
    Join Date
    Oct 2010
    Posts
    653

    Default

    Quote Originally Posted by hyenergix
    Thanks to CM4 40% downpayment, 1-2 bedders MMs will continue to do well. Precisely because of the 40% downpayment, the MM owners have good holding power.
    good holding power...till....TOP.

Similar Threads

  1. Private property price index only increase by 0.9 percent
    By Arcachon in forum Singapore Private Condominium Property Discussion and News
    Replies: 0
    -: 01-10-21, 09:34
  2. Private property price index up 1.3% in Q2: URA flash estimate
    By reporter2 in forum Singapore Private Condominium Property Discussion and News
    Replies: 0
    -: 01-07-19, 14:52
  3. URA revamps property price index methodology
    By reporter2 in forum Singapore Private Condominium Property Discussion and News
    Replies: 2
    -: 10-04-15, 00:03
  4. Implications behind the improved URA Property Price Index
    By vip in forum Singapore Private Condominium Property Discussion and News
    Replies: 0
    -: 04-04-15, 17:22
  5. Hong Kong property price index hit new high
    By phantom_opera in forum Coffeeshop Talk
    Replies: 35
    -: 09-07-13, 12:18

Posting Permissions

  • You may not post new threads
  • You may not post replies
  • You may not post attachments
  • You may not edit your posts
  •